What We’re Seeing
“The more things change, the more they stay the same.” – Jean-Baptiste Alphonse Karr
The fourth quarter offered a reprieve from what had been an extraordinary year of volatility. After April’s tariff shock sent markets tumbling and October’s government shutdown—the longest in American history at 43 days—delayed critical economic data, the economy and markets found their footing heading into year-end. GDP growth came in stronger than expected, corporate earnings continued their streak of expansion, and the S&P 500 closed the year at record highs, delivering an 18% return and marking the third consecutive year of double-digit gains. The Federal Reserve, navigating without fresh inflation data for weeks, continued its measured easing with rate cuts in October and December, bringing rates to 3.5%-3.75% while signaling patience ahead. Beneath the headlines, something more fundamental may be taking shape.
For all the attention paid to cycles and indicators, we may be underestimating the structural shift underway. AI has moved from novelty to utility with remarkable speed—no longer a curiosity or toy, but an increasingly integrated part of how work gets done. Consider the trajectory: the printing press democratized the written word; broadcast media added voice and image; the internet removed borders and connected billions; and now artificial intelligence offers something approaching a personal oracle—a library of Alexandria in your pocket. Nearly 90% of organizations now use AI in some form, while hyperscaler capital expenditure on AI infrastructure has doubled in two years to over $400 billion. Whether this spending yields the productivity gains its proponents promise remains an open question, but the investment itself is already reshaping corporate cash flows, labor markets, and the composition of economic growth.
And yet, consumer sentiment remains stubbornly bleak. This disconnect, between transformative potential and pessimistic mood, matters. Building anything worthwhile, whether a business, a portfolio, or a future, requires some measure of optimism that the effort is worth undertaking. Markets work the same way: they depend on the collective belief that tomorrow can be better than today. A financial plan doesn’t optimize for the present; it optimizes for the future. History tells us expansions last longer than contractions, that bull markets outlast bear markets by wide margins, and that disciplined long-term investors have been rewarded for staying the course. We have extraordinary tools at our disposal now. The question heading into 2026 is whether we have the confidence to use them.
5 Major Takeaways
-
The Trade Reversal: Net Exports Turn Positive:
For years, net exports have subtracted from U.S. GDP growth, the natural result of Americans consuming more than they produce. That pattern reversed dramatically in Q3 2025, when net trade contributed +1.6 percentage points to GDP growth. The shift was driven by tariff-related import declines as businesses drew down inventories built up in anticipation of trade barriers, combined with a meaningful rebound in exports. Whether this marks a durable realignment in global trade flows or a temporary adjustment to policy uncertainty remains an open question heading into 2026. -
A Hiring Recession Within an Economic Expansion:
The U.S. added just 584,000 jobs in 2025—the weakest year for hiring since 2003 outside of an actual recession. Monthly job gains averaged under 50,000, a fraction of the 2+ million added annually in prior years. Hiring rates have fallen to levels last seen in 2013. Yet unemployment sits at 4.4%, and GDP growth remains solid. The explanation: companies have stopped hiring but haven't started firing. Layoffs remain historically low at 1.7 million. This hiring freeze within an otherwise healthy economy presents an unusual backdrop for workers and policymakers alike. -
Immigration Policy Meets Labor Force Math:
Net international migration collapsed from roughly 2.2 million in 2024 to between 0.5 and 1 million in 2025. San Francisco Fed economists estimate that immigration policy changes accounted for approximately half of the slowdown in employment growth this year, as the foreign-born labor force contracted by 600,000 to 1 million workers. For sectors that have historically relied on immigrant labor—construction, agriculture, hospitality—the math is straightforward: fewer workers means staffing constraints and wage pressures. With the native-born workforce aging and labor force participation stabilizing, the arithmetic points toward near-zero labor force growth absent policy changes. -
The $500 Billion AI Wager:
Hyperscaler capital expenditure—the combined spending of Amazon, Microsoft, Alphabet, and Meta—exceeded $400 billion in 2025 and is projected to approach $600 billion in 2026, roughly double the level from two years ago. This capital is funding data centers, semiconductor purchases, and power infrastructure at an unprecedented scale. Enterprise adoption has followed: surveys suggest 60-80% of large organizations are now piloting or deploying AI tools. At Davos, some argued that AI adoption has become cover for broader digitization initiatives that might otherwise face internal resistance. The open question remains whether productivity gains will ultimately justify the capital deployed. -
Long Summers, Short Winters:
The average bull market since 1950 has lasted roughly 1,000 days—nearly three years—with average gains exceeding 177%. The average bear market has lasted just 289 days with average losses of -35%. Recent bull markets have stretched even longer: the 2009-2020 expansion ran for nearly 4,000 days; the 1987-2000 bull exceeded 4,400 days. This asymmetry—long periods of gains punctuated by shorter, sharper declines—is the fundamental case for staying invested through volatility. Bear markets arrive every few years, but they end. Bull markets have historically rewarded patience.
One Big Number
0
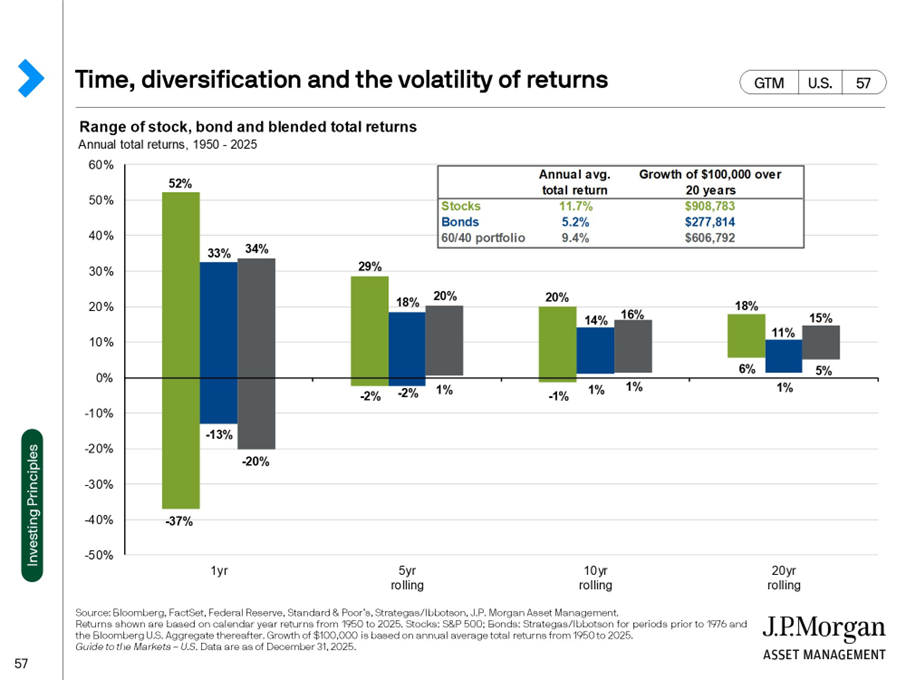
The number of five-year periods since 1950 in which a balanced 60/40 portfolio lost money.
In any single year, a diversified portfolio can swing wildly, balanced portfolios have returned as much as +34% and as little as -20% in a calendar year. But extend the horizon to five years, and something remarkable emerges: a 60/40 portfolio has never posted a negative return over any rolling five-year period in the past 75 years. The worst five-year stretch still delivered +1% annualized. Time doesn’t eliminate risk, but it has historically transformed the range of outcomes. For investors with the discipline to stay the course, the data offers a simple message: short-term volatility is the price of admission; long-term participation has been the reward.
And One Big Chart
Range of stock, bond and blended total returns from 1950 – 2025. 1
Sources:
1 Source: J.P. Morgan Asset Management, Guide to the Markets. Data as of December 31, 2025.
Options expressed in the attached article are those of the author/speaker and are not necessarily those of Raymond James. All opinions are as of this date and are subject to change without notice. Investing involves risk and you may incur a profit or loss regardless of strategy selected, including diversification as asset allocation. Past performance may not be indicative of future results. Prior to making an investment decision, please consult with your financial advisor about your individual situation. The stock indexes mentioned are unmanaged and cannot be invested into directly.
S&P 500: This index is a broad-based measurement of changes in stock market conditions based on the average performance of 500 widely help common stocks. It consists of 400 industrial, 40 utility, 20 transportation, and 40 financial companies listed on the U.S. market exchanges. This is a capitalization-weighted calculated on a total return basis with dividends reinvested. The S&P represents about 75% of the NYSE market capitalization.